In [4]:
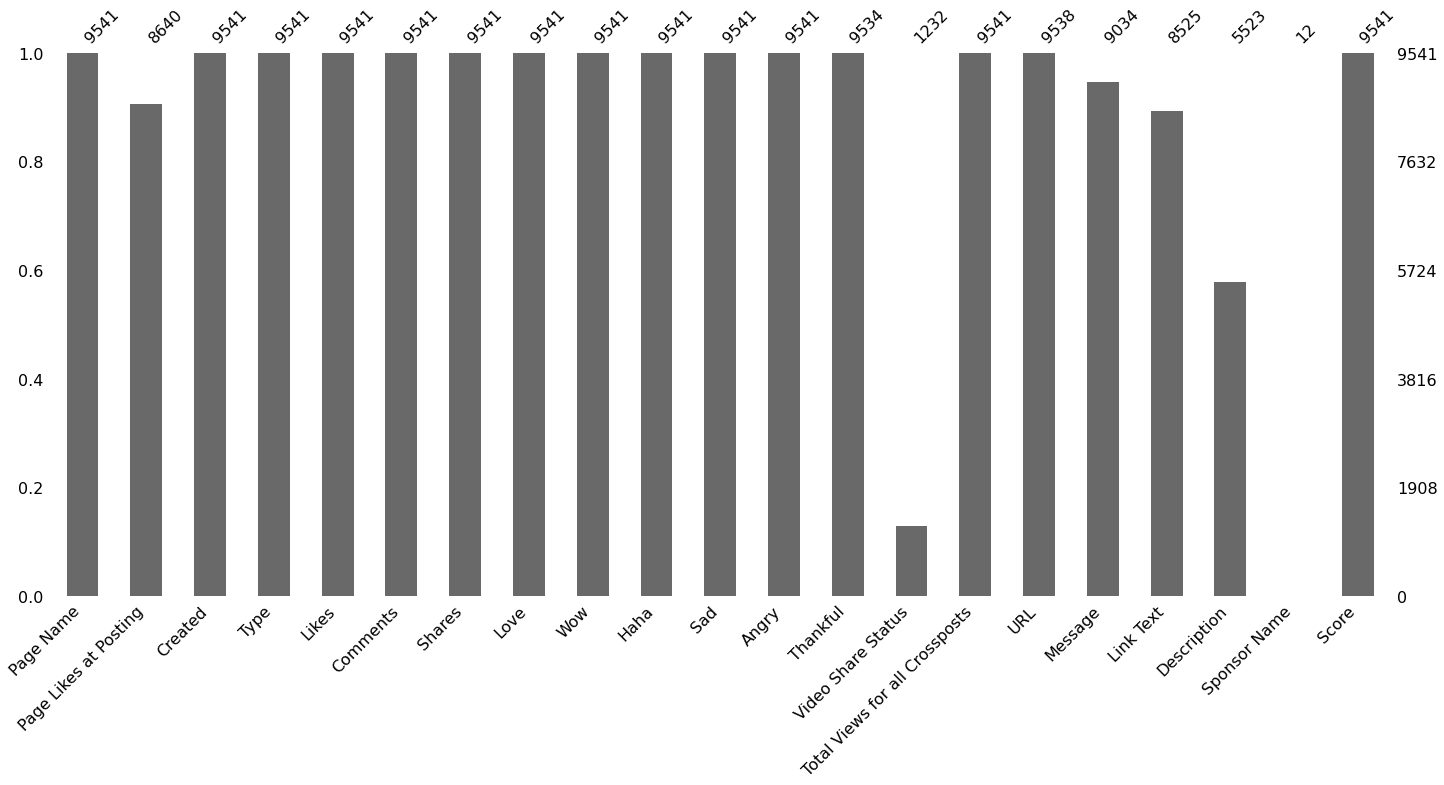
msno.bar(df)
Out[4]:
<AxesSubplot:>

import pandas as pd
import numpy as np
import matplotlib.pyplot as plt
import string
import seaborn as sns
import nltk
from nltk.stem import WordNetLemmatizer
from nltk.tokenize import RegexpTokenizer
from nltk.corpus import stopwords
import missingno as msno
import re
import miceforest as mf
from wordcloud import WordCloud
from textblob import TextBlob
from scipy import stats
from sklearn.metrics.pairwise import cosine_similarity
from sklearn.metrics import silhouette_score
from sklearn.feature_extraction.text import TfidfVectorizer
from sklearn.cluster import KMeans
import param
import panel as pn
pn.extension()
df = pd.read_csv("2019-02-25-16-09-36-EST-Historical-Report-2016-01-01--2019-02-26 - 2019-02-25-16-09-36-EST-Historical-Report-2016-01-01--2019-02-26.csv")
df.head()
| Page Name | User Name | Page Id | Page Likes at Posting | Created | Type | Likes | Comments | Shares | Love | ... | URL | Message | Link | Final Link | Link Text | Description | Sponsor Id | Sponsor Name | Score | Yes | |
|---|---|---|---|---|---|---|---|---|---|---|---|---|---|---|---|---|---|---|---|---|---|
| 0 | Planet Paws | PlanetPaws.ca | 1.124379e+14 | 1578676 | 2017-02-26 09:50:24 EST | Native Video | 75461 | 42879 | 894482 | 2406 | ... | https://www.facebook.com/PlanetPaws.ca/posts/1... | Over-vaccinating and the overdosing of pet vac... | https://www.facebook.com/PlanetPaws.ca/videos/... | NaN | The Dangers of Vaccine Overdosing | NaN | NaN | NaN | 1091367.0 | 1 |
| 1 | Natalie Bomke Fox 32 Chicago | NatalieBomkeFox32Chicago | 1.668040e+14 | 112316 | 2018-02-02 09:30:00 EST | Native Video | 135485 | 41642 | 627972 | 27306 | ... | https://www.facebook.com/NatalieBomkeFox32Chic... | CANCER VACCINE SUCCESSFUL IN TESTING... Stanfo... | https://www.facebook.com/NatalieBomkeFox32Chic... | NaN | CANCER VACCINE SUCCESSFUL IN TESTING... | NaN | NaN | NaN | 861565.0 | 1 |
| 2 | FOX 2 Detroit | WJBKFox2Detroit | 3.636580e+11 | 819062 | 2018-02-05 14:45:02 EST | Native Video | 84593 | 15447 | 580983 | 14496 | ... | https://www.facebook.com/WJBKFox2Detroit/posts... | CANCER VACCINE SUCCESSFUL IN TESTING: The vacc... | https://www.facebook.com/WJBKFox2Detroit/video... | NaN | CANCER VACCINE SUCCESSFUL | NaN | NaN | NaN | 712774.0 | 1 |
| 3 | Gizmodo | gizmodo | 5.718759e+09 | 1555197 | 2017-11-20 17:40:46 EST | Native Video | 122206 | 20150 | 433945 | 11158 | ... | https://www.facebook.com/gizmodo/posts/1015594... | Paul Alexander spends nearly every hour, of ev... | https://www.facebook.com/gizmodo/videos/101559... | NaN | The Last of the Iron Lungs | NaN | NaN | NaN | 674298.0 | 1 |
| 4 | Hashem Al-Ghaili | ScienceNaturePage | 6.935046e+14 | 13426659 | 2018-06-22 11:08:29 EDT | Native Video | 40464 | 3112 | 322544 | 3762 | ... | https://www.facebook.com/ScienceNaturePage/pos... | Cancer Vaccine Has Been Approved For Human Tri... | https://www.facebook.com/ScienceNaturePage/vid... | NaN | Cancer Vaccine Has Been Approved For Human Trials | NaN | NaN | NaN | 373126.0 | 1 |
5 rows × 29 columns
list(df.columns)
['Page Name', 'User Name', 'Page Id', 'Page Likes at Posting', 'Created', 'Type', 'Likes', 'Comments', 'Shares', 'Love', 'Wow', 'Haha', 'Sad', 'Angry', 'Thankful', 'Video Share Status', 'Post Views', 'Total Views', 'Total Views for all Crossposts', 'URL', 'Message', 'Link', 'Final Link', 'Link Text', 'Description', 'Sponsor Id', 'Sponsor Name', 'Score', 'Yes']
df = df.drop(['User Name', 'Page Id', 'Link', 'Final Link', 'Sponsor Id', 'Yes', 'Post Views', 'Total Views'], axis = 1)
df.head()
| Page Name | Page Likes at Posting | Created | Type | Likes | Comments | Shares | Love | Wow | Haha | ... | Angry | Thankful | Video Share Status | Total Views for all Crossposts | URL | Message | Link Text | Description | Sponsor Name | Score | |
|---|---|---|---|---|---|---|---|---|---|---|---|---|---|---|---|---|---|---|---|---|---|
| 0 | Planet Paws | 1578676 | 2017-02-26 09:50:24 EST | Native Video | 75461 | 42879 | 894482 | 2406 | 7310 | 106 | ... | 36332 | 5 | crosspost | 38821399 | https://www.facebook.com/PlanetPaws.ca/posts/1... | Over-vaccinating and the overdosing of pet vac... | The Dangers of Vaccine Overdosing | NaN | NaN | 1091367.0 |
| 1 | Natalie Bomke Fox 32 Chicago | 112316 | 2018-02-02 09:30:00 EST | Native Video | 135485 | 41642 | 627972 | 27306 | 28412 | 446 | ... | 141 | 0 | original | 0 | https://www.facebook.com/NatalieBomkeFox32Chic... | CANCER VACCINE SUCCESSFUL IN TESTING... Stanfo... | CANCER VACCINE SUCCESSFUL IN TESTING... | NaN | NaN | 861565.0 |
| 2 | FOX 2 Detroit | 819062 | 2018-02-05 14:45:02 EST | Native Video | 84593 | 15447 | 580983 | 14496 | 16707 | 319 | ... | 139 | 0 | crosspost | 27529776 | https://www.facebook.com/WJBKFox2Detroit/posts... | CANCER VACCINE SUCCESSFUL IN TESTING: The vacc... | CANCER VACCINE SUCCESSFUL | NaN | NaN | 712774.0 |
| 3 | Gizmodo | 1555197 | 2017-11-20 17:40:46 EST | Native Video | 122206 | 20150 | 433945 | 11158 | 34444 | 218 | ... | 163 | 0 | crosspost | 38621026 | https://www.facebook.com/gizmodo/posts/1015594... | Paul Alexander spends nearly every hour, of ev... | The Last of the Iron Lungs | NaN | NaN | 674298.0 |
| 4 | Hashem Al-Ghaili | 13426659 | 2018-06-22 11:08:29 EDT | Native Video | 40464 | 3112 | 322544 | 3762 | 2923 | 128 | ... | 99 | 0 | original | 0 | https://www.facebook.com/ScienceNaturePage/pos... | Cancer Vaccine Has Been Approved For Human Tri... | Cancer Vaccine Has Been Approved For Human Trials | NaN | NaN | 373126.0 |
5 rows × 21 columns
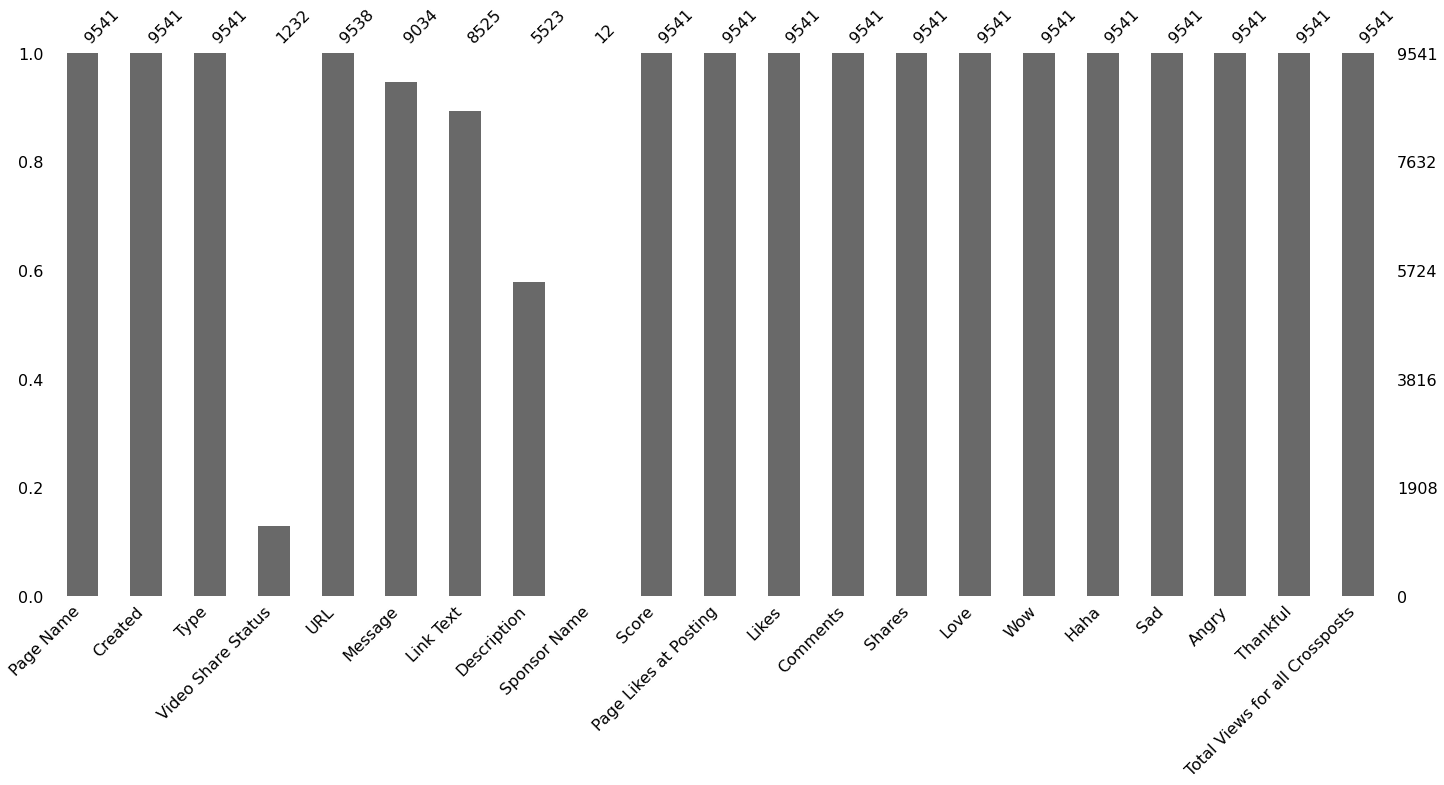
msno.bar(df)
<AxesSubplot:>
df.dtypes
Page Name object Page Likes at Posting object Created object Type object Likes int64 Comments int64 Shares int64 Love int64 Wow int64 Haha int64 Sad int64 Angry int64 Thankful object Video Share Status object Total Views for all Crossposts object URL object Message object Link Text object Description object Sponsor Name object Score float64 dtype: object
Created is supposed to be date, some data types should be int, such as Thankful, Page Likes at Posting. Using regular expression, I can detect which Created date has wrong format.
misplaced_df = df[df['Created'].str.match('^[0-9]{4}-[0-9]{2}-[0-9]{2} ([0-9]+(:[0-9]+)+) [a-zA-Z]+$')== False]
misplaced_df
| Page Name | Page Likes at Posting | Created | Type | Likes | Comments | Shares | Love | Wow | Haha | ... | Angry | Thankful | Video Share Status | Total Views for all Crossposts | URL | Message | Link Text | Description | Sponsor Name | Score | |
|---|---|---|---|---|---|---|---|---|---|---|---|---|---|---|---|---|---|---|---|---|---|
| 1154 | Rodney Habib | 2018-06-17 19:22:32 EDT | Native Video | 2096 | 312 | 3704 | 75 | 110 | 0 | 725 | ... | 0 | share | 0 | NaN | Over-vaccinating and the overdosing of pet vac... | https://www.facebook.com/PlanetPaws.ca/videos/... | Over-vaccinating and the overdosing of pet vac... | NaN | 7878 | NaN |
| 1928 | Rodney Habib | 2018-07-15 09:43:36 EDT | Native Video | 1827 | 250 | 2668 | 81 | 79 | 0 | 293 | ... | 0 | share | 0 | NaN | The day John Robb shook up the American Govern... | https://www.facebook.com/PlanetPaws.ca/videos/... | Over-vaccinating and the overdosing of pet vac... | NaN | 5614 | NaN |
| 3278 | Truong Huy San | 2018-12-07 04:00:39 EST | Status | 3248 | 0 | 269 | 106 | 27 | 196 | 22 | ... | 0 | NaN | 0 | https://www.facebook.com/Osinhuyduc/posts/1886... | GIÁO DỤC VỊ SINH VIÊN HAY VỊ NGƯỜI NGỒI TRÊN B... | NaN | NaN | NaN | 3887 | NaN |
| 3439 | Rodney Habib | 2018-08-14 10:47:19 EDT | Photo | 1146 | 203 | 2191 | 56 | 94 | 0 | 48 | ... | 0 | NaN | 0 | NaN | Do you know? By Rodney Habib | https://www.facebook.com/PlanetPaws.ca/photos/... | SO JUST HOW LONG DO YOUR PET’S SHOTS LAST?\n\n... | NaN | 3762 | NaN |
| 6695 | Mike Acebedo Lopez | 2017-12-01 13:21:30 EST | Status | 1268 | 0 | 357 | 8 | 11 | 5 | 222 | ... | 0 | NaN | 0 | https://www.facebook.com/MikeAcebedoLopez/post... | Noynoy Aquino's government potentially sentenc... | NaN | NaN | NaN | 2264 | NaN |
| 7208 | Trang Minh Nguyen | 2018-10-04 08:29:38 EDT | Photo | 654 | 223 | 1203 | 45 | 0 | 0 | 0 | ... | 0 | NaN | 0 | https://www.facebook.com/trangmnguyen132/posts... | Chia sẻ với các bố mẹ lịch tiêm chủng mà Mầm N... | https://www.facebook.com/photo.php?fbid=204533... | NaN | NaN | 2125 | NaN |
| 9379 | Yaya Trương Nhi | 2018-08-21 23:59:26 EDT | Link | 1483 | 12 | 119 | 78 | 3 | 1 | 0 | ... | 0 | NaN | 0 | https://www.facebook.com/yayatruongnhi/posts/1... | ❤️❤️❤️ Cảm ơn những Tiến sỹ đã cứu cả thế giới... | http://vietbao.info/suc-khoe/tin-vui-my-da-ngh... | Giáo sư Ronald Levy – cha đẻ của vaccine chống... | NaN | 1696 | NaN |
7 rows × 21 columns
missplaced_indices = misplaced_df.index.tolist()
df.loc[missplaced_indices,'Page Likes at Posting'] = misplaced_df.loc[missplaced_indices,'Type']
df.loc[missplaced_indices,'Created'] = misplaced_df.loc[missplaced_indices,'Page Likes at Posting']
df.loc[missplaced_indices,'Type'] = misplaced_df.loc[missplaced_indices,'Created']
df.loc[missplaced_indices,'Score'] = misplaced_df.loc[missplaced_indices,'Sponsor Name']
df.loc[missplaced_indices,'Sponsor Name'] = np.NaN
df.loc[missplaced_indices,'Message'] = misplaced_df.loc[missplaced_indices,'URL']
df.loc[missplaced_indices,'Total Views for all Crossposts'] = 0
df.loc[[3278, 6695, 7208, 9379],'URL'] = misplaced_df.loc[[3278, 6695, 7208, 9379],'Total Views for all Crossposts']
df.loc[[1154, 1928, 3439],'URL'] = misplaced_df.loc[[1154, 1928, 3439],'Message']
df.loc[missplaced_indices,'Message'] = np.NaN
df['Created'] = pd.to_datetime(df['Created']).dt.strftime('%d-%m-%Y')
df.dtypes
C:\Users\tanke\.virtualenvs\test-facebook-A5e32CXY\lib\site-packages\dateutil\parser\_parser.py:1213: UnknownTimezoneWarning: tzname EST identified but not understood. Pass `tzinfos` argument in order to correctly return a timezone-aware datetime. In a future version, this will raise an exception.
warnings.warn("tzname {tzname} identified but not understood. "
C:\Users\tanke\.virtualenvs\test-facebook-A5e32CXY\lib\site-packages\dateutil\parser\_parser.py:1213: UnknownTimezoneWarning: tzname EDT identified but not understood. Pass `tzinfos` argument in order to correctly return a timezone-aware datetime. In a future version, this will raise an exception.
warnings.warn("tzname {tzname} identified but not understood. "
Page Name object Page Likes at Posting object Created object Type object Likes int64 Comments int64 Shares int64 Love int64 Wow int64 Haha int64 Sad int64 Angry int64 Thankful object Video Share Status object Total Views for all Crossposts object URL object Message object Link Text object Description object Sponsor Name object Score object dtype: object
df['Page Likes at Posting'] = pd.to_numeric(df['Page Likes at Posting'])
df['Total Views for all Crossposts'] = pd.to_numeric(df['Total Views for all Crossposts'])
df['Score'] = pd.to_numeric(df['Score'])
df.dtypes
Page Name object Page Likes at Posting float64 Created object Type object Likes int64 Comments int64 Shares int64 Love int64 Wow int64 Haha int64 Sad int64 Angry int64 Thankful object Video Share Status object Total Views for all Crossposts int64 URL object Message object Link Text object Description object Sponsor Name object Score float64 dtype: object
df[df['Thankful'].str.match('^\d$')== False]['Thankful']
6 10 185 691 239 39 272 38 314 33 973 123 1154 share 1255 12 1700 12 1928 share 2195 63 2848 22 3048 42 3311 10 3739 15 4035 15 4857 70 5844 100 6183 26 8191 37 8482 87 8535 10 9357 26 9502 38 Name: Thankful, dtype: object
For now set Thankful that are not numbers to NA. Imputation will come next.
df.loc[df.Thankful == 'share', 'Thankful'] = np.NaN
df['Thankful'] = pd.to_numeric(df['Thankful'])
df.dtypes
Page Name object Page Likes at Posting float64 Created object Type object Likes int64 Comments int64 Shares int64 Love int64 Wow int64 Haha int64 Sad int64 Angry int64 Thankful float64 Video Share Status object Total Views for all Crossposts int64 URL object Message object Link Text object Description object Sponsor Name object Score float64 dtype: object
msno.bar(df)
<AxesSubplot:>
Use other numerical variables to impute 'Page Likes at Posting' and 'Thankful'
impute_columns = ['Page Likes at Posting',
'Likes',
'Comments',
'Shares',
'Love',
'Wow',
'Haha',
'Sad',
'Angry',
'Thankful',
'Total Views for all Crossposts']
df_imputation = df[impute_columns]
df_imputation.head()
| Page Likes at Posting | Likes | Comments | Shares | Love | Wow | Haha | Sad | Angry | Thankful | Total Views for all Crossposts | |
|---|---|---|---|---|---|---|---|---|---|---|---|
| 0 | 1578676.0 | 75461 | 42879 | 894482 | 2406 | 7310 | 106 | 32391 | 36332 | 5.0 | 38821399 |
| 1 | 112316.0 | 135485 | 41642 | 627972 | 27306 | 28412 | 446 | 161 | 141 | 0.0 | 0 |
| 2 | 819062.0 | 84593 | 15447 | 580983 | 14496 | 16707 | 319 | 90 | 139 | 0.0 | 27529776 |
| 3 | 1555197.0 | 122206 | 20150 | 433945 | 11158 | 34444 | 218 | 52014 | 163 | 0.0 | 38621026 |
| 4 | 13426659.0 | 40464 | 3112 | 322544 | 3762 | 2923 | 128 | 94 | 99 | 0.0 | 0 |
df_amp = mf.ampute_data(df_imputation,perc=0.25,random_state=666)
kernel = mf.MultipleImputedKernel(
df_amp,
datasets=4,
save_all_iterations=True,
random_state=666
)
kernel.mice(3)
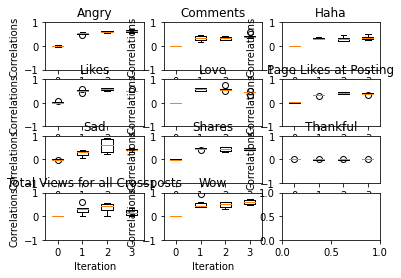
kernel.plot_correlations()
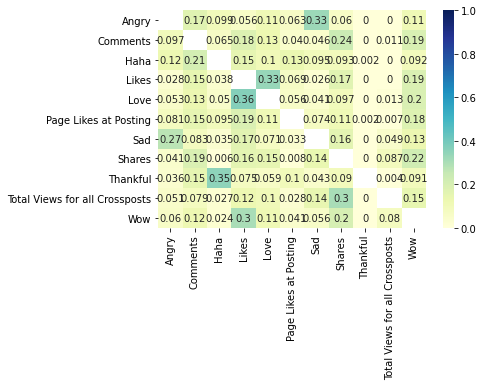
kernel.plot_feature_importance(annot=True,cmap="YlGnBu",vmin=0, vmax=1)
AxesSubplot(0.125,0.125;0.62x0.755)
kernel_df = pd.concat([kernel.complete_data(0), kernel.complete_data(1), kernel.complete_data(2), kernel.complete_data(3)]).groupby(level=0).mean().round(decimals=0)
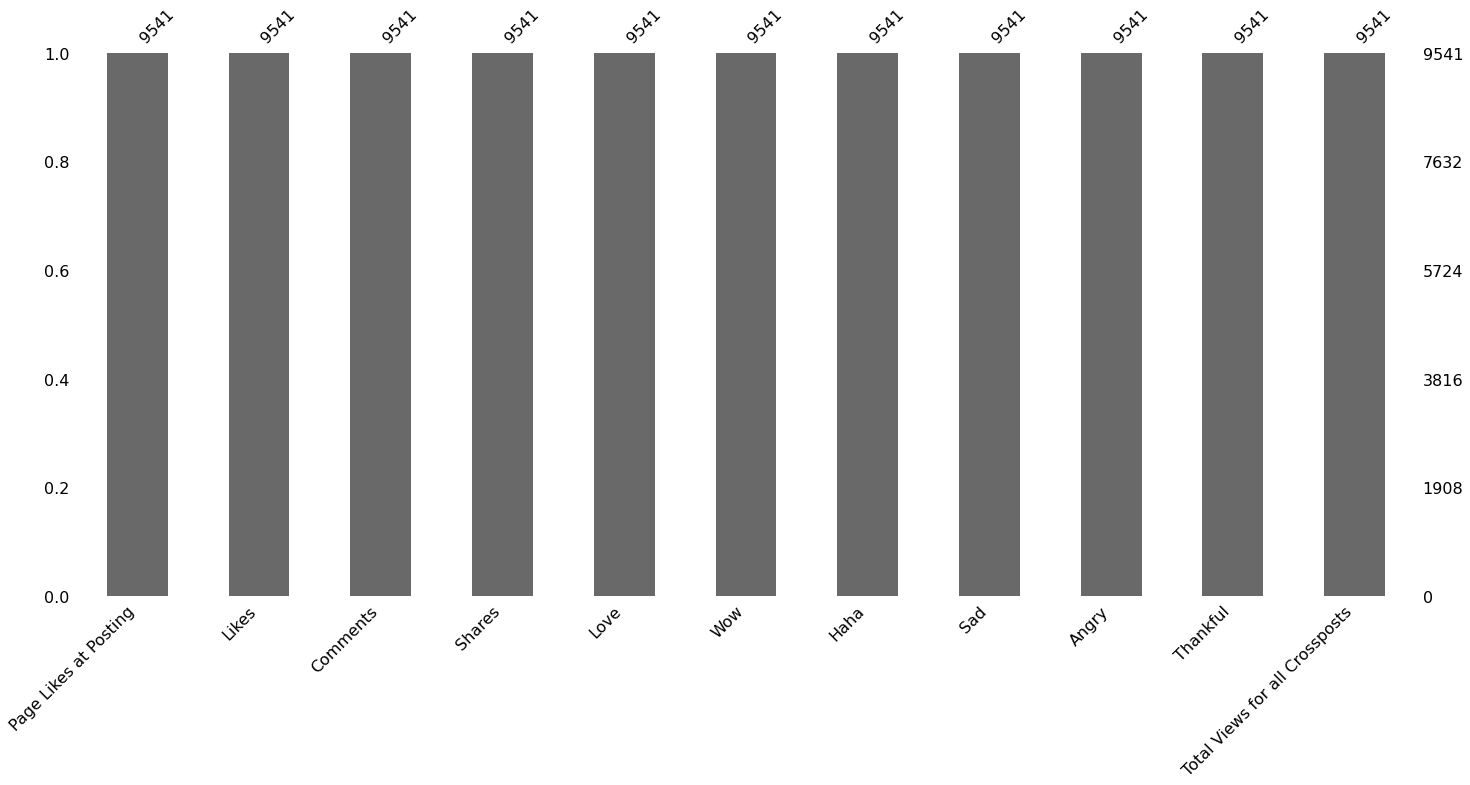
msno.bar(kernel_df)
<AxesSubplot:>
kernel_df.head()
| Page Likes at Posting | Likes | Comments | Shares | Love | Wow | Haha | Sad | Angry | Thankful | Total Views for all Crossposts | |
|---|---|---|---|---|---|---|---|---|---|---|---|
| 0 | 1578676.0 | 75461.0 | 42879.0 | 894482.0 | 2406.0 | 7310.0 | 106.0 | 32391.0 | 2224.0 | 0.0 | 38821399.0 |
| 1 | 112316.0 | 135485.0 | 41642.0 | 627972.0 | 6685.0 | 28412.0 | 446.0 | 161.0 | 141.0 | 0.0 | 0.0 |
| 2 | 819062.0 | 84593.0 | 15447.0 | 580983.0 | 14496.0 | 12640.0 | 2973.0 | 1772.0 | 139.0 | 0.0 | 9634769.0 |
| 3 | 5631828.0 | 74635.0 | 20150.0 | 433945.0 | 11158.0 | 34444.0 | 218.0 | 52014.0 | 3388.0 | 0.0 | 38621026.0 |
| 4 | 13426659.0 | 40464.0 | 5602.0 | 24774.0 | 3762.0 | 2923.0 | 128.0 | 146.0 | 99.0 | 0.0 | 0.0 |
df = df.drop(impute_columns, axis = 1)
df = df.merge(kernel_df, left_index=True, right_index=True)
msno.bar(df)
<AxesSubplot:>
df['Video Share Status'].unique()
array(['crosspost', 'original', nan, 'share', '0'], dtype=object)
df['Video Share Status'] = np.where(df['Video Share Status'] == '0', np.NaN, df['Video Share Status'])
df['Video Share Status'].unique()
array(['crosspost', 'original', nan, 'share'], dtype=object)
Remove all shared posts from another page.
df[df['Video Share Status']=="crosspost"]
| Page Name | Created | Type | Video Share Status | URL | Message | Link Text | Description | Sponsor Name | Score | ... | Likes | Comments | Shares | Love | Wow | Haha | Sad | Angry | Thankful | Total Views for all Crossposts | |
|---|---|---|---|---|---|---|---|---|---|---|---|---|---|---|---|---|---|---|---|---|---|
| 0 | Planet Paws | 26-02-2017 | Native Video | crosspost | https://www.facebook.com/PlanetPaws.ca/posts/1... | Over-vaccinating and the overdosing of pet vac... | The Dangers of Vaccine Overdosing | NaN | NaN | 1091367.0 | ... | 75461.0 | 42879.0 | 894482.0 | 2406.0 | 7310.0 | 106.0 | 32391.0 | 2224.0 | 0.0 | 38821399.0 |
| 2 | FOX 2 Detroit | 05-02-2018 | Native Video | crosspost | https://www.facebook.com/WJBKFox2Detroit/posts... | CANCER VACCINE SUCCESSFUL IN TESTING: The vacc... | CANCER VACCINE SUCCESSFUL | NaN | NaN | 712774.0 | ... | 84593.0 | 15447.0 | 580983.0 | 14496.0 | 12640.0 | 2973.0 | 1772.0 | 139.0 | 0.0 | 9634769.0 |
| 3 | Gizmodo | 20-11-2017 | Native Video | crosspost | https://www.facebook.com/gizmodo/posts/1015594... | Paul Alexander spends nearly every hour, of ev... | The Last of the Iron Lungs | NaN | NaN | 674298.0 | ... | 74635.0 | 20150.0 | 433945.0 | 11158.0 | 34444.0 | 218.0 | 52014.0 | 3388.0 | 0.0 | 38621026.0 |
| 16 | Fusion | 20-11-2017 | Native Video | crosspost | https://www.facebook.com/fusiontv/posts/101559... | Paul Alexander spends nearly every hour of eve... | The Last of the Iron Lungs | NaN | NaN | 99116.0 | ... | 54270.0 | 8285.0 | 68735.0 | 2630.0 | 4600.0 | 34.0 | 6463.0 | 24.0 | 0.0 | 38539076.0 |
| 27 | NowThis | 01-03-2017 | Native Video | crosspost | https://www.facebook.com/NowThisNews/posts/146... | An experimental vaccine therapy left HIV patie... | A Vaccine Therapy Left HIV Patients Virus-Free | NaN | NaN | 67578.0 | ... | 34488.0 | 746.0 | 23102.0 | 1024.0 | 1103.0 | 74.0 | 7.0 | 2.0 | 0.0 | 3938467.0 |
| ... | ... | ... | ... | ... | ... | ... | ... | ... | ... | ... | ... | ... | ... | ... | ... | ... | ... | ... | ... | ... | ... |
| 9181 | J.B. Handley | 19-11-2017 | Native Video | crosspost | https://www.facebook.com/jbhandleyjr/posts/190... | #11: All-time most viewed videos. I started th... | Vaccine adjuvants cause autoimmunity | NaN | NaN | 1729.0 | ... | 737.0 | 112.0 | 784.0 | 78.0 | 53.0 | 1.0 | 7.0 | 7.0 | 0.0 | 224430.0 |
| 9235 | Rockets Are Cool | 10-07-2017 | Native Video | crosspost | https://www.facebook.com/RocketsAreCool/posts/... | A tiny patch could replace painful needles. | Cutting-Edge Vaccine Patch | NaN | NaN | 1720.0 | ... | 658.0 | 93.0 | 828.0 | 40.0 | 72.0 | 3.0 | 0.0 | 3.0 | 0.0 | 0.0 |
| 9426 | Gates Foundation | 20-07-2017 | Native Video | crosspost | https://www.facebook.com/gatesfoundation/posts... | How do you look for weak spots on viruses to t... | How 3D Can Build Better Vaccines | NaN | NaN | 1691.0 | ... | 1080.0 | 176.0 | 311.0 | 102.0 | 20.0 | 2.0 | 0.0 | 2.0 | 0.0 | 0.0 |
| 9474 | Stop Mandatory Vaccination | 12-11-2017 | Native Video | crosspost | https://www.facebook.com/StopMandatoryVaccinat... | Tasha Dāvid has 6 vaccine injured kids and 2 h... | “My Family Was Devastated By Vaccines” by Tash... | NaN | NaN | 1683.0 | ... | 416.0 | 53.0 | 968.0 | 19.0 | 21.0 | 0.0 | 159.0 | 47.0 | 0.0 | 81718.0 |
| 9475 | J.B. Handley | 16-11-2017 | Native Video | crosspost | https://www.facebook.com/jbhandleyjr/posts/190... | #13: All-time most viewed videos. I started th... | Four nurses tell the truth about vaccines | NaN | NaN | 1683.0 | ... | 730.0 | 55.0 | 743.0 | 103.0 | 33.0 | 1.0 | 2.0 | 3.0 | 2.0 | 164748.0 |
218 rows × 21 columns
Too many missing, drop this variable
df = df.drop(['Video Share Status'], axis = 1)
df['Sponsor Name'].unique()
array([nan, 'Gates Foundation', 'Great Big Story', 'NowThis Future',
'World Health Organization African Region',
'American Senior Communities', 'Ministry of Health Zambia',
'World Health Organization (Eastern Mediterranean Regional Office)',
'Daily Wire', 'Johnson & Johnson', 'SourceFed', 'Providr',
'Icahn School of Medicine at Mount Sinai'], dtype=object)
These sponsors are legitimate authorities in heathcare. Perhaps they are flagged as anti-vaccination due to the comments. In fact, Bill Gates is often accused of 'creating virus'.
df = df.drop(['Sponsor Name'], axis = 1)
df.head()
| Page Name | Created | Type | URL | Message | Link Text | Description | Score | Page Likes at Posting | Likes | Comments | Shares | Love | Wow | Haha | Sad | Angry | Thankful | Total Views for all Crossposts | |
|---|---|---|---|---|---|---|---|---|---|---|---|---|---|---|---|---|---|---|---|
| 0 | Planet Paws | 26-02-2017 | Native Video | https://www.facebook.com/PlanetPaws.ca/posts/1... | Over-vaccinating and the overdosing of pet vac... | The Dangers of Vaccine Overdosing | NaN | 1091367.0 | 1578676.0 | 75461.0 | 42879.0 | 894482.0 | 2406.0 | 7310.0 | 106.0 | 32391.0 | 2224.0 | 0.0 | 38821399.0 |
| 1 | Natalie Bomke Fox 32 Chicago | 02-02-2018 | Native Video | https://www.facebook.com/NatalieBomkeFox32Chic... | CANCER VACCINE SUCCESSFUL IN TESTING... Stanfo... | CANCER VACCINE SUCCESSFUL IN TESTING... | NaN | 861565.0 | 112316.0 | 135485.0 | 41642.0 | 627972.0 | 6685.0 | 28412.0 | 446.0 | 161.0 | 141.0 | 0.0 | 0.0 |
| 2 | FOX 2 Detroit | 05-02-2018 | Native Video | https://www.facebook.com/WJBKFox2Detroit/posts... | CANCER VACCINE SUCCESSFUL IN TESTING: The vacc... | CANCER VACCINE SUCCESSFUL | NaN | 712774.0 | 819062.0 | 84593.0 | 15447.0 | 580983.0 | 14496.0 | 12640.0 | 2973.0 | 1772.0 | 139.0 | 0.0 | 9634769.0 |
| 3 | Gizmodo | 20-11-2017 | Native Video | https://www.facebook.com/gizmodo/posts/1015594... | Paul Alexander spends nearly every hour, of ev... | The Last of the Iron Lungs | NaN | 674298.0 | 5631828.0 | 74635.0 | 20150.0 | 433945.0 | 11158.0 | 34444.0 | 218.0 | 52014.0 | 3388.0 | 0.0 | 38621026.0 |
| 4 | Hashem Al-Ghaili | 22-06-2018 | Native Video | https://www.facebook.com/ScienceNaturePage/pos... | Cancer Vaccine Has Been Approved For Human Tri... | Cancer Vaccine Has Been Approved For Human Trials | NaN | 373126.0 | 13426659.0 | 40464.0 | 5602.0 | 24774.0 | 3762.0 | 2923.0 | 128.0 | 146.0 | 99.0 | 0.0 | 0.0 |
Sponsor name is dropped. For all the missing message, link text and description, replace NA with empty string.
df['Message'].fillna("", inplace=True)
df['Link Text'].fillna("", inplace=True)
df['Description'].fillna("", inplace=True)
msno.bar(df)
<AxesSubplot:>
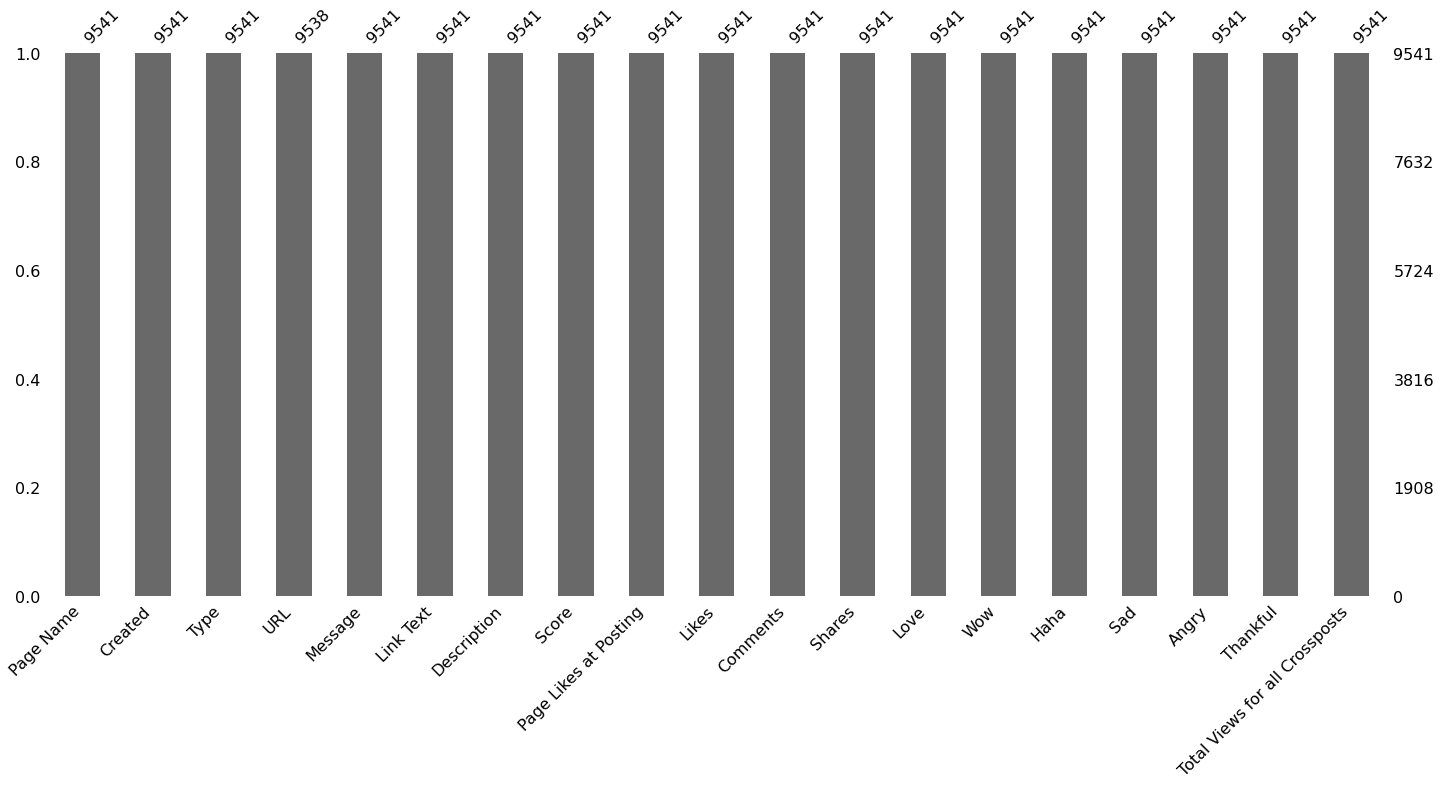
Combine message, link text and description into a new column, text.
df['Text'] = df['Message'] + df['Link Text'] + df['Description']
df.head()
| Page Name | Created | Type | URL | Message | Link Text | Description | Score | Page Likes at Posting | Likes | Comments | Shares | Love | Wow | Haha | Sad | Angry | Thankful | Total Views for all Crossposts | Text | |
|---|---|---|---|---|---|---|---|---|---|---|---|---|---|---|---|---|---|---|---|---|
| 0 | Planet Paws | 26-02-2017 | Native Video | https://www.facebook.com/PlanetPaws.ca/posts/1... | Over-vaccinating and the overdosing of pet vac... | The Dangers of Vaccine Overdosing | 1091367.0 | 1578676.0 | 75461.0 | 42879.0 | 894482.0 | 2406.0 | 7310.0 | 106.0 | 32391.0 | 2224.0 | 0.0 | 38821399.0 | Over-vaccinating and the overdosing of pet vac... | |
| 1 | Natalie Bomke Fox 32 Chicago | 02-02-2018 | Native Video | https://www.facebook.com/NatalieBomkeFox32Chic... | CANCER VACCINE SUCCESSFUL IN TESTING... Stanfo... | CANCER VACCINE SUCCESSFUL IN TESTING... | 861565.0 | 112316.0 | 135485.0 | 41642.0 | 627972.0 | 6685.0 | 28412.0 | 446.0 | 161.0 | 141.0 | 0.0 | 0.0 | CANCER VACCINE SUCCESSFUL IN TESTING... Stanfo... | |
| 2 | FOX 2 Detroit | 05-02-2018 | Native Video | https://www.facebook.com/WJBKFox2Detroit/posts... | CANCER VACCINE SUCCESSFUL IN TESTING: The vacc... | CANCER VACCINE SUCCESSFUL | 712774.0 | 819062.0 | 84593.0 | 15447.0 | 580983.0 | 14496.0 | 12640.0 | 2973.0 | 1772.0 | 139.0 | 0.0 | 9634769.0 | CANCER VACCINE SUCCESSFUL IN TESTING: The vacc... | |
| 3 | Gizmodo | 20-11-2017 | Native Video | https://www.facebook.com/gizmodo/posts/1015594... | Paul Alexander spends nearly every hour, of ev... | The Last of the Iron Lungs | 674298.0 | 5631828.0 | 74635.0 | 20150.0 | 433945.0 | 11158.0 | 34444.0 | 218.0 | 52014.0 | 3388.0 | 0.0 | 38621026.0 | Paul Alexander spends nearly every hour, of ev... | |
| 4 | Hashem Al-Ghaili | 22-06-2018 | Native Video | https://www.facebook.com/ScienceNaturePage/pos... | Cancer Vaccine Has Been Approved For Human Tri... | Cancer Vaccine Has Been Approved For Human Trials | 373126.0 | 13426659.0 | 40464.0 | 5602.0 | 24774.0 | 3762.0 | 2923.0 | 128.0 | 146.0 | 99.0 | 0.0 | 0.0 | Cancer Vaccine Has Been Approved For Human Tri... |
Preprocessing removes web links, numbers, punctuations. After tokenisation and lemmatisation, non-english words and stopwords are removed.
words = set(nltk.corpus.words.words())
def preprocess_text(text):
# Tokenise words while ignoring punctuation
text = re.sub(r'http\S+', '', text)
text = ''.join([i for i in text if not i.isdigit()])
tokeniser = RegexpTokenizer(r'\w+')
tokens = tokeniser.tokenize(text)
# Lowercase and lemmatise
lemmatiser = WordNetLemmatizer()
lemmas = [lemmatiser.lemmatize(token.lower(), pos='v') for token in tokens]
# Remove stopwords
keywords= [lemma for lemma in lemmas if lemma not in stopwords.words('english')]
keywords= " ".join(str(x) for x in keywords)
return " ".join(w for w in nltk.wordpunct_tokenize(keywords) \
if w.lower() in words or not w.isalpha())
df.shape[0]
9541
I had to chunk this section, as it takes forever to run on my computer.
chunk_size = int(df.shape[0] / 10)
chunks = list()
for start in range(0, df.shape[0], chunk_size):
df_subset = df.iloc[start:start + chunk_size].copy()
df_subset['Text'] = df_subset['Text'].apply(preprocess_text)
chunks.append(df_subset)
df = pd.concat(chunks)
df.head()
| Page Name | Created | Type | URL | Message | Link Text | Description | Score | Page Likes at Posting | Likes | Comments | Shares | Love | Wow | Haha | Sad | Angry | Thankful | Total Views for all Crossposts | Text | |
|---|---|---|---|---|---|---|---|---|---|---|---|---|---|---|---|---|---|---|---|---|
| 0 | Planet Paws | 26-02-2017 | Native Video | https://www.facebook.com/PlanetPaws.ca/posts/1... | Over-vaccinating and the overdosing of pet vac... | The Dangers of Vaccine Overdosing | 1091367.0 | 1578676.0 | 75461.0 | 42879.0 | 894482.0 | 2406.0 | 7310.0 | 106.0 | 32391.0 | 2224.0 | 0.0 | 38821399.0 | vaccinate overdose pet become global issue dog... | |
| 1 | Natalie Bomke Fox 32 Chicago | 02-02-2018 | Native Video | https://www.facebook.com/NatalieBomkeFox32Chic... | CANCER VACCINE SUCCESSFUL IN TESTING... Stanfo... | CANCER VACCINE SUCCESSFUL IN TESTING... | 861565.0 | 112316.0 | 135485.0 | 41642.0 | 627972.0 | 6685.0 | 28412.0 | 446.0 | 161.0 | 141.0 | 0.0 | 0.0 | cancer vaccine successful test inject combinat... | |
| 2 | FOX 2 Detroit | 05-02-2018 | Native Video | https://www.facebook.com/WJBKFox2Detroit/posts... | CANCER VACCINE SUCCESSFUL IN TESTING: The vacc... | CANCER VACCINE SUCCESSFUL | 712774.0 | 819062.0 | 84593.0 | 15447.0 | 580983.0 | 14496.0 | 12640.0 | 2973.0 | 1772.0 | 139.0 | 0.0 | 9634769.0 | cancer vaccine successful test vaccine destroy... | |
| 3 | Gizmodo | 20-11-2017 | Native Video | https://www.facebook.com/gizmodo/posts/1015594... | Paul Alexander spends nearly every hour, of ev... | The Last of the Iron Lungs | 674298.0 | 5631828.0 | 74635.0 | 20150.0 | 433945.0 | 11158.0 | 34444.0 | 218.0 | 52014.0 | 3388.0 | 0.0 | 38621026.0 | spend nearly every hour every day cocoon iron ... | |
| 4 | Hashem Al-Ghaili | 22-06-2018 | Native Video | https://www.facebook.com/ScienceNaturePage/pos... | Cancer Vaccine Has Been Approved For Human Tri... | Cancer Vaccine Has Been Approved For Human Trials | 373126.0 | 13426659.0 | 40464.0 | 5602.0 | 24774.0 | 3762.0 | 2923.0 | 128.0 | 146.0 | 99.0 | 0.0 | 0.0 | cancer vaccine approve human cancer vaccine ap... |
These are the rows with no text remain at all after pre-processing
df[df['Text'].str.len()==0]
| Page Name | Created | Type | URL | Message | Link Text | Description | Score | Page Likes at Posting | Likes | Comments | Shares | Love | Wow | Haha | Sad | Angry | Thankful | Total Views for all Crossposts | Text | |
|---|---|---|---|---|---|---|---|---|---|---|---|---|---|---|---|---|---|---|---|---|
| 889 | Good Health Journal | 19-01-2016 | Photo | https://www.facebook.com/390774211023677/posts... | ျဖည့္ထုိးႏုိင္သည့္ကာကြယ္ေဆးမ်ား --------------... | Timeline Photos | 9119.0 | 3776566.0 | 3448.0 | 70.0 | 358.0 | 2.0 | 0.0 | 0.0 | 0.0 | 0.0 | 0.0 | 0.0 | ||
| 896 | Yoyarlay | 23-01-2016 | Photo | https://www.facebook.com/YoYarLay/posts/101590... | ျဖည့္ထုိးႏုိင္သည့္ကာကြယ္ေဆးမ်ား --------------... | Timeline Photos | 9081.0 | 3187808.0 | 5377.0 | 421.0 | 3622.0 | 0.0 | 0.0 | 0.0 | 0.0 | 2.0 | 0.0 | 0.0 | ||
| 3278 | Truong Huy San | 07-12-2018 | Status | https://www.facebook.com/Osinhuyduc/posts/1886... | 3887.0 | 3248.0 | 0.0 | 269.0 | 106.0 | 10.0 | 196.0 | 22.0 | 70.0 | 460.0 | 0.0 | 0.0 | ||||
| 4293 | China Xinhua News | 01-07-2016 | Link | https://www.facebook.com/XinhuaMyanmar/posts/6... | အဆုတ္ေရာင္ကာကြယ္ေဆးသစ္ ကေလးငယ္တစ္ဦး မက်န္ ထို... | အဆုတ္ေရာင္ကာကြယ္ေဆးသစ္ ကေလးငယ္တစ္ဦး မက်န္ ထို... | ေနျပည္ေတာ္၊ ဇူလိုင္ ၁ ရက္ (ဆင္ဟြာ) ကမၻာ့က်န္းမ... | 3187.0 | 7439522.0 | 2914.0 | 21.0 | 252.0 | 0.0 | 2.0 | 0.0 | 0.0 | 0.0 | 0.0 | 0.0 | |
| 6109 | UNICEF Bangladesh | 10-07-2017 | Photo | https://www.facebook.com/unicef.bd/posts/16076... | ধন্যবাদ সকল মা-বাবাকে যারা সময়মতো টিকা দিয়ে বা... | Timeline Photos | 2449.0 | 532837.0 | 4177.0 | 27.0 | 150.0 | 8.0 | 2.0 | 0.0 | 0.0 | 1.0 | 0.0 | 0.0 | ||
| 6695 | Mike Acebedo Lopez | 01-12-2017 | Status | https://www.facebook.com/MikeAcebedoLopez/post... | 2264.0 | 1268.0 | 0.0 | 357.0 | 8.0 | 4.0 | 5.0 | 222.0 | 393.0 | 1072.0 | 0.0 | 0.0 | ||||
| 7208 | Trang Minh Nguyen | 04-10-2018 | Photo | https://www.facebook.com/trangmnguyen132/posts... | 2125.0 | 346663.0 | 223.0 | 1203.0 | 45.0 | 0.0 | 47.0 | 0.0 | 0.0 | 267.0 | 0.0 | 232550.0 |
Removed the rows that don't have any valid text. Now, I compute TF-IDF and distance.
df = df[df['Text'].str.len()>0]
tfIdfVectorizer=TfidfVectorizer(use_idf=True)
tfIdf = tfIdfVectorizer.fit_transform(df['Text'])
feature_names = tfIdfVectorizer.get_feature_names()
tfIdf_df = pd.DataFrame(tfIdf[0].T.todense(), index=feature_names, columns=["TF-IDF"])
tfIdf_df = tfIdf_df.sort_values('TF-IDF', ascending=False)
tfIdf_df.head()
| TF-IDF | |
|---|---|
| overdose | 0.598978 |
| witness | 0.270074 |
| terrible | 0.270074 |
| vet | 0.239843 |
| global | 0.216992 |
dist = 1 - cosine_similarity(tfIdf)
dist
array([[-4.44089210e-16, 9.93218548e-01, 9.89330364e-01, ...,
9.96673486e-01, 9.29683600e-01, 9.93216475e-01],
[ 9.93218548e-01, 0.00000000e+00, 2.41630256e-01, ...,
9.90077156e-01, 8.34622929e-01, 9.94305985e-01],
[ 9.89330364e-01, 2.41630256e-01, -2.22044605e-16, ...,
9.95606815e-01, 8.84105697e-01, 9.91041289e-01],
...,
[ 9.96673486e-01, 9.90077156e-01, 9.95606815e-01, ...,
-2.22044605e-16, 9.97136383e-01, 9.00124760e-01],
[ 9.29683600e-01, 8.34622929e-01, 8.84105697e-01, ...,
9.97136383e-01, -2.22044605e-16, 9.94160427e-01],
[ 9.93216475e-01, 9.94305985e-01, 9.91041289e-01, ...,
9.00124760e-01, 9.94160427e-01, 0.00000000e+00]])
Sentiment analysis can now be done.
def polarity(x):
return TextBlob(x).sentiment[0]
def subjectivity(x):
return TextBlob(x).sentiment[1]
df['Polarity'] = df['Text'].apply(polarity)
df['Subjectivity'] = df['Text'].apply(subjectivity)
df.head(3)
| Page Name | Created | Type | URL | Message | Link Text | Description | Score | Page Likes at Posting | Likes | ... | Love | Wow | Haha | Sad | Angry | Thankful | Total Views for all Crossposts | Text | Polarity | Subjectivity | |
|---|---|---|---|---|---|---|---|---|---|---|---|---|---|---|---|---|---|---|---|---|---|
| 0 | Planet Paws | 26-02-2017 | Native Video | https://www.facebook.com/PlanetPaws.ca/posts/1... | Over-vaccinating and the overdosing of pet vac... | The Dangers of Vaccine Overdosing | 1091367.0 | 1578676.0 | 75461.0 | ... | 2406.0 | 7310.0 | 106.0 | 32391.0 | 2224.0 | 0.0 | 38821399.0 | vaccinate overdose pet become global issue dog... | -0.066667 | 0.583333 | |
| 1 | Natalie Bomke Fox 32 Chicago | 02-02-2018 | Native Video | https://www.facebook.com/NatalieBomkeFox32Chic... | CANCER VACCINE SUCCESSFUL IN TESTING... Stanfo... | CANCER VACCINE SUCCESSFUL IN TESTING... | 861565.0 | 112316.0 | 135485.0 | ... | 6685.0 | 28412.0 | 446.0 | 161.0 | 141.0 | 0.0 | 0.0 | cancer vaccine successful test inject combinat... | 0.379464 | 0.601339 | |
| 2 | FOX 2 Detroit | 05-02-2018 | Native Video | https://www.facebook.com/WJBKFox2Detroit/posts... | CANCER VACCINE SUCCESSFUL IN TESTING: The vacc... | CANCER VACCINE SUCCESSFUL | 712774.0 | 819062.0 | 84593.0 | ... | 14496.0 | 12640.0 | 2973.0 | 1772.0 | 139.0 | 0.0 | 9634769.0 | cancer vaccine successful test vaccine destroy... | 0.512500 | 0.712500 |
3 rows × 22 columns
For EDA, I will use z-score to remove outlier, only for the purpose of EDA. I want to analyze the comment section of the most commented posts, so I will still keep the original dataframe with outliers.
status_metrics = ['Score', 'Page Likes at Posting', 'Likes', 'Comments',
'Shares', 'Love', 'Wow', 'Haha', 'Sad', 'Angry', 'Thankful',
'Total Views for all Crossposts', 'Polarity', 'Subjectivity']
z_scores = np.abs(stats.zscore(df[status_metrics]))
z_scores
array([[5.52201234e+01, 1.44142455e-01, 1.27134407e+01, ...,
2.90857353e+01, 7.18857996e-01, 7.92476531e-01],
[4.35356545e+01, 4.47081767e-01, 2.31547289e+01, ...,
6.19053515e-02, 1.48677659e+00, 8.65307710e-01],
[3.59702556e+01, 3.01073183e-01, 1.43019694e+01, ...,
7.17201182e+00, 2.14449418e+00, 1.31493491e+00],
...,
[1.86200013e-01, 3.52983738e-01, 3.04248841e-01, ...,
2.95152340e-02, 7.23117918e-01, 2.86147209e-01],
[1.86200013e-01, 1.33031072e-01, 2.83026711e-01, ...,
6.19053515e-02, 1.00725318e+00, 7.58045095e-01],
[1.86200013e-01, 1.07252378e-02, 3.44605679e-01, ...,
6.19053515e-02, 4.01034734e-01, 1.11028531e+00]])
df.shape[0]
9534
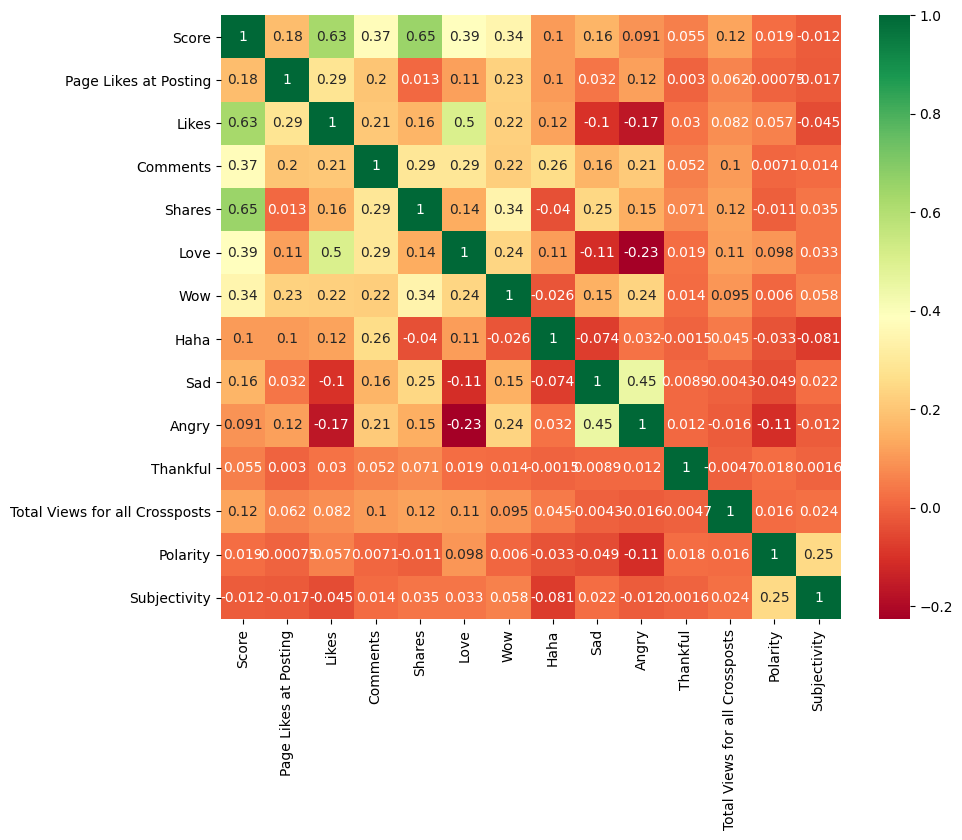
Angry reactions have highest average, followed by love and share. Thankful is extremely low, almost 0 on average. It could be because Thankful is a reaction that was introduced last.
df_o = df[(z_scores < 3).all(axis=1)]
df_o.describe()
| Score | Page Likes at Posting | Likes | Comments | Shares | Love | Wow | Haha | Sad | Angry | Thankful | Total Views for all Crossposts | Polarity | Subjectivity | |
|---|---|---|---|---|---|---|---|---|---|---|---|---|---|---|
| count | 8819.000000 | 8.819000e+03 | 8819.000000 | 8819.000000 | 8819.000000 | 8819.000000 | 8819.000000 | 8819.000000 | 8819.000000 | 8819.000000 | 8819.000000 | 8.819000e+03 | 8819.000000 | 8819.000000 |
| mean | 3997.134029 | 1.673022e+06 | 1841.368976 | 190.766413 | 1452.849756 | 105.459009 | 73.275088 | 51.584647 | 103.016442 | 131.138791 | 0.026874 | 1.119640e+04 | 0.075021 | 0.379761 |
| std | 3495.881871 | 2.575138e+06 | 1968.704536 | 283.029199 | 1895.926428 | 169.605461 | 123.171708 | 146.648540 | 223.887119 | 238.699886 | 0.471293 | 1.034664e+05 | 0.176332 | 0.242108 |
| min | 1674.000000 | 3.950000e+02 | 0.000000 | 0.000000 | 0.000000 | 0.000000 | 0.000000 | 0.000000 | 0.000000 | 0.000000 | 0.000000 | 0.000000e+00 | -0.525000 | 0.000000 |
| 25% | 2107.000000 | 2.213700e+05 | 700.000000 | 54.000000 | 448.000000 | 6.000000 | 6.000000 | 1.000000 | 2.000000 | 1.000000 | 0.000000 | 0.000000e+00 | 0.000000 | 0.214286 |
| 50% | 2852.000000 | 7.362250e+05 | 1321.000000 | 101.000000 | 945.000000 | 40.000000 | 29.000000 | 4.000000 | 15.000000 | 11.000000 | 0.000000 | 0.000000e+00 | 0.052941 | 0.411111 |
| 75% | 4467.000000 | 1.795225e+06 | 2209.000000 | 209.000000 | 1691.000000 | 132.000000 | 90.000000 | 19.000000 | 99.500000 | 165.000000 | 0.000000 | 0.000000e+00 | 0.166667 | 0.526523 |
| max | 60774.000000 | 1.668844e+07 | 19436.000000 | 3153.000000 | 39618.000000 | 1534.000000 | 1680.000000 | 1270.000000 | 2235.000000 | 1571.000000 | 22.000000 | 2.973804e+06 | 0.675000 | 1.000000 |
The source of the dataset did not explain what 'score' means, however it seems to be moderately correlated with likes and shares. Likes and loves share a positive correlation of 0.5, perhaps due to how they are quite similar, compared to other reactions.
color = plt.get_cmap('RdYlGn').copy()
plt.figure(figsize=(10,8), dpi= 100)
color.set_bad('lightblue')
sns.heatmap(df_o[status_metrics].corr(), annot=True, cmap=color)
<AxesSubplot:>
I create a dashboard to show box plots before and after outlier treatment. I create a class using param library and through bd2.param, I get the selected metric. There's quite a lot of outliers. I had to use append_end function to clear my plt because there is always an extra line plot. To get updated chart, I use gcf.
class BoxDashboard2(param.Parameterized):
metric = param.ObjectSelector(default='Page Likes at Posting', objects=status_metrics)
plt.figure(figsize=(12,8), dpi= 100)
def box_plot_1(self):
plt.clf()
sns.boxplot(x=df[self.metric])
return plt.gcf()
def box_plot_2(self):
plt.clf()
sns.boxplot(x=df_o[self.metric])
return plt.gcf()
def append_end(self):
plt.clf()
return ""
bd2 = BoxDashboard2(name='')
dashboard = pn.Column('Boxplot Dashboard',
bd2.param,
pn.Tabs(
('Original', bd2.box_plot_1),
('Outlier removed', bd2.box_plot_2),
('',bd2.append_end)
)
)
dashboard.embed()
<Figure size 1728x1152 with 0 Axes>
The main reason I am clustering in this section, is because I want analyze the comment section in the most commented posts, so I am dividing the posts into clusters to sample the comments.
sil = []
inertias = []
kmax = 10
for k in range(2, kmax+1):
kmeans = KMeans(n_clusters = k).fit(tfIdf)
labels = kmeans.labels_
sil.append(silhouette_score(tfIdf, labels, metric = 'euclidean'))
inertias.append(kmeans.inertia_)
plt.plot(range(2, kmax+1), inertias)
plt.title('Elbow method')
plt.xlabel('No of clusters')
plt.ylabel('Error')
plt.show()
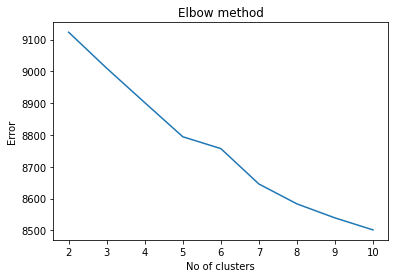
Elbow method does not work all the time, such as how it is not clear cut in this case.
plt.plot(range(2, kmax+1), sil)
plt.xlabel('No of clusters')
plt.ylabel('Silhouette score')
plt.show()
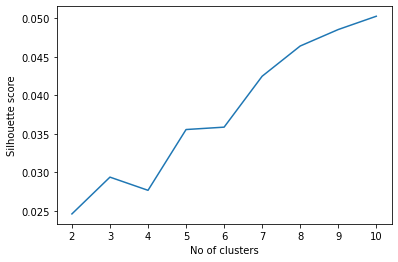
Peak performance is seen in n=6, increase in Silhouette score diminishes after 6. So, number of custers is set to 6 and each post is assigned a cluster.
km = KMeans(n_clusters=6, random_state=666)
km.fit(tfIdf)
df['Cluster'] = km.labels_.tolist()
df.head()
| Page Name | Created | Type | URL | Message | Link Text | Description | Score | Page Likes at Posting | Likes | ... | Wow | Haha | Sad | Angry | Thankful | Total Views for all Crossposts | Text | Polarity | Subjectivity | Cluster | |
|---|---|---|---|---|---|---|---|---|---|---|---|---|---|---|---|---|---|---|---|---|---|
| 0 | Planet Paws | 26-02-2017 | Native Video | https://www.facebook.com/PlanetPaws.ca/posts/1... | Over-vaccinating and the overdosing of pet vac... | The Dangers of Vaccine Overdosing | 1091367.0 | 1578676.0 | 75461.0 | ... | 7310.0 | 106.0 | 32391.0 | 2224.0 | 0.0 | 38821399.0 | vaccinate overdose pet become global issue dog... | -0.066667 | 0.583333 | 4 | |
| 1 | Natalie Bomke Fox 32 Chicago | 02-02-2018 | Native Video | https://www.facebook.com/NatalieBomkeFox32Chic... | CANCER VACCINE SUCCESSFUL IN TESTING... Stanfo... | CANCER VACCINE SUCCESSFUL IN TESTING... | 861565.0 | 112316.0 | 135485.0 | ... | 28412.0 | 446.0 | 161.0 | 141.0 | 0.0 | 0.0 | cancer vaccine successful test inject combinat... | 0.379464 | 0.601339 | 4 | |
| 2 | FOX 2 Detroit | 05-02-2018 | Native Video | https://www.facebook.com/WJBKFox2Detroit/posts... | CANCER VACCINE SUCCESSFUL IN TESTING: The vacc... | CANCER VACCINE SUCCESSFUL | 712774.0 | 819062.0 | 84593.0 | ... | 12640.0 | 2973.0 | 1772.0 | 139.0 | 0.0 | 9634769.0 | cancer vaccine successful test vaccine destroy... | 0.512500 | 0.712500 | 4 | |
| 3 | Gizmodo | 20-11-2017 | Native Video | https://www.facebook.com/gizmodo/posts/1015594... | Paul Alexander spends nearly every hour, of ev... | The Last of the Iron Lungs | 674298.0 | 5631828.0 | 74635.0 | ... | 34444.0 | 218.0 | 52014.0 | 3388.0 | 0.0 | 38621026.0 | spend nearly every hour every day cocoon iron ... | 0.050000 | 0.233333 | 4 | |
| 4 | Hashem Al-Ghaili | 22-06-2018 | Native Video | https://www.facebook.com/ScienceNaturePage/pos... | Cancer Vaccine Has Been Approved For Human Tri... | Cancer Vaccine Has Been Approved For Human Trials | 373126.0 | 13426659.0 | 40464.0 | ... | 2923.0 | 128.0 | 146.0 | 99.0 | 0.0 | 0.0 | cancer vaccine approve human cancer vaccine ap... | 0.000000 | 0.100000 | 4 |
5 rows × 23 columns
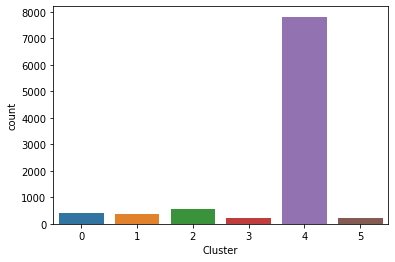
There is a class imbalance issue.
ax = sns.countplot(x="Cluster", data=df)
I want to see the trends of cluster vs created date. So, I group cluster and created.
date_post_count = pd.DataFrame({'Count' : df.groupby( [ "Cluster", "Created"] ).size()}).reset_index()
date_post_count['Created'] = pd.to_datetime(date_post_count['Created'])
date_post_count = date_post_count.sort_values(by=['Created'])
date_post_count.head()
| Cluster | Created | Count | |
|---|---|---|---|
| 479 | 2 | 2016-01-01 | 1 |
| 986 | 4 | 2016-01-01 | 7 |
| 481 | 2 | 2016-01-02 | 1 |
| 990 | 4 | 2016-01-02 | 8 |
| 2134 | 5 | 2016-01-03 | 1 |
I built a dashboard here for my line plot to show cluster vs created date. I'm glad that there's at least a little data from 2020, meaning there's probably few mentions of the pandemic.
class DateDashboard(param.Parameterized):
Cluster = param.ObjectSelector(default=0, objects=sorted(list(df.Cluster.unique())))
plt.figure(figsize=(12,8), dpi= 100)
def line_plot(self):
plt.clf()
plt.plot('Created', 'Count', data=date_post_count[date_post_count['Cluster']==self.Cluster], linestyle = 'solid')
return plt.gcf()
def append_end(self):
plt.clf()
return ""
dd = DateDashboard(name='')
dashboard = pn.Column('Date Dashboard',
dd.param,
dd.line_plot,
dd.append_end
)
dashboard.embed()
<Figure size 1728x1152 with 0 Axes>
This is similar to the last cell, but more complicated. I seperate out cluster vs created date into its own dashboard, because this dashboard will use the original dataframe. Through get_data, I subset dataframe by selected cluster number. With the subset dataframe, I can get new TF-IDF, word cloud, average reactions and correlation plots to display in the dashboard.
dashboard_cluster = 1
class RatingsDashboard(param.Parameterized):
plt.figure(figsize=(12,8), dpi= 100)
Cluster = param.ObjectSelector(default=dashboard_cluster, objects=sorted(list(df.Cluster.unique())))
def get_data(self):
class_df = df[(df.Cluster==self.Cluster)].copy()
return class_df
def get_tfidf(self):
df_temp = self.get_data()
tfIdf_temp = tfIdfVectorizer.fit_transform(df_temp['Text'])
tfIdf_df_temp = pd.DataFrame(tfIdf_temp[0].T.todense(), index=tfIdfVectorizer.get_feature_names(), columns=["TF-IDF"])
tfIdf_df_temp = tfIdf_df_temp.sort_values('TF-IDF', ascending=False)
return(tfIdf_df_temp)
def word_cloud(self):
wordcloud = WordCloud(background_color="white", max_words=50).generate_from_frequencies(self.get_tfidf().sum(axis=1))
plt.clf()
plt.axis("off")
im = plt.imshow(wordcloud, interpolation='bilinear')
return plt.gcf()
def table_view(self, x=10):
return self.get_tfidf().head(x)
def count_plot(self):
plt.clf()
ax = sns.countplot(y="Page Name", data=self.get_data(), order=pd.value_counts(self.get_data()['Page Name']).iloc[:10].index)
return plt.gcf()
def status_table(self):
return self.get_data().mean()
def corr_plot(self):
plt.clf()
color = plt.get_cmap('RdYlGn').copy()
color.set_bad('lightblue')
corrMatrix = self.get_data()[status_metrics].corr()
sns.heatmap(corrMatrix, annot=True, cmap=color)
return plt.gcf()
def most_commented_posts(self):
return self.get_data().sort_values(by=['Likes', 'Comments'], ascending=False).head(20)['URL']
def append_end(self):
plt.clf()
return ""
rd = RatingsDashboard(name='')
dashboard = pn.Column('Cluster Dashboard',
rd.param,
pn.Tabs(
('Most Common Words', rd.table_view),
('Word Cloud', rd.word_cloud),
('Most Common Page Names', rd.count_plot),
('Average Status Metrics', rd.status_table),
('Status Correlations', rd.corr_plot),
('Target Posts', rd.most_commented_posts),
('',rd.append_end))
)
dashboard.embed()
<Figure size 1728x1152 with 0 Axes>
Unfortunately, for all clusters, polarity and subjectivity don't just seem to be correlated with anything else. Like tends to be correlated with comments, shares and love. To a lesser extent, I would say sad and angry are like this too.
In terms of the word clouds, it seems to me that cluster 3 and 4 are mostly words related to vet and animals. The fact that in cluster 3, there is only one FaceBook page, which is an animal shelter, futher supports my point.
I wanted to do further analysis on the comments of the most commented posts, but unfortunately, quite a lot of the most commented posts were deleted and censored, presumably by FaceBook Team.
So yeah, I'm afraid I've hit a roadblock here. I will start another anti-vax analysis project using a different dataset.