In [61]:
ax = sns.countplot(x="continent", data=df)
Pandas, numpy and matplotlib are standard libraries. Seaborn and matplotlib are for visualization. Nltk and sklearn are mostly used for natural language processing in this case. Geopy, folium, pygal and IPython.display allows me to work with country coordinates and plot on world map.
# import pandas as pd
import numpy as np
import matplotlib.pyplot as plt
import string
import seaborn as sns
import nltk
from nltk.stem import WordNetLemmatizer
from nltk.tokenize import RegexpTokenizer
from nltk.corpus import stopwords
import pycountry_convert as pc
from wordcloud import WordCloud
from textblob import TextBlob
from geopy.geocoders import Nominatim
import folium
from folium.plugins import MarkerCluster
import pygal
from IPython.display import SVG, display
from sklearn.feature_extraction.text import TfidfVectorizer
from sklearn.metrics.pairwise import cosine_similarity

df = pd.read_csv('cia_trafficking.csv')
df.head(3)
| country | text | |
|---|---|---|
| 0 | Algeria | current situation: Algeria is a transit and, t... |
| 1 | Antigua and Barbuda | current situation: Antigua and Barbuda is a de... |
| 2 | Belarus | current situation: Belarus is a source, transi... |
def country_to_continent(country_name):
    try:
        country_alpha2 = pc.country_name_to_country_alpha2(country_name)
        country_continent_code = pc.country_alpha2_to_continent_code(country_alpha2)
        country_continent_name = pc.convert_continent_code_to_continent_name(country_continent_code)
        return country_continent_name
    except:
        return float("NaN")

df['continent'] = df['country'].apply(country_to_continent)
df.head(3)
| country | text | continent | |
|---|---|---|---|
| 0 | Algeria | current situation: Algeria is a transit and, t... | Africa |
| 1 | Antigua and Barbuda | current situation: Antigua and Barbuda is a de... | North America |
| 2 | Belarus | current situation: Belarus is a source, transi... | Europe |
df[df.isna().any(axis=1)]
| country | text | continent | |
|---|---|---|---|
| 8 | Burma | current situation: Burma is a source country f... | NaN |
| 14 | Congo, Democratic Republic of the | current situation: The Democratic Republic of ... | NaN |
| 15 | Congo, Republic of the | current situation: the Republic of the Congo i... | NaN |
| 23 | Gambia, The | current situation: The Gambia is a source and ... | NaN |
| 31 | Korea, North | current situation: North Korea is a source cou... | NaN |
| 58 | Timor-Leste | current situation: Timor-Leste is a source and... | NaN |
| 65 | World | current situation: the International Labour Or... | NaN |
Had to change 'Burma' to 'Myanmar', otherwise geolocator library won't be able to find its coordinates. Same goes for other countries. I also dropped 'World'
df.loc[df['country'] == 'Burma', 'country'] = 'Myanmar'
df.loc[df['country'] == 'Congo, Democratic Republic of the', 'country'] = 'Democratic Republic of the Congo'
df.loc[df['country'] == 'Congo, Republic of the', 'country'] = 'Republic of the Congo'
df.loc[df['country'] == 'Gambia, The', 'country'] = 'The Gambia'
df.loc[df['country'] == 'Korea, North', 'country'] = 'North Korea'
df = df[df.country != 'World']
df['continent'] = df['country'].apply(country_to_continent)
df[df.isna().any(axis=1)]
| country | text | continent | |
|---|---|---|---|
| 23 | The Gambia | current situation: The Gambia is a source and ... | NaN |
| 58 | Timor-Leste | current situation: Timor-Leste is a source and... | NaN |
I add in continent manually for Gambia and East Timor, since pycountry_convert just doesn't recognize them.
df.loc[df['country'] == 'The Gambia', 'continent'] = 'Africa'
df.loc[df['country'] == 'Timor-Leste', 'continent'] = 'Asia'
df[df.isna().any(axis=1)]
| country | text | continent |
|---|
Get the coordinates of each country.
geolocator = Nominatim(user_agent="myapplication")
def geolocate(country):
    try:
        # Geolocate the center of the country
        loc = geolocator.geocode(country)
        # And return latitude and longitude
        return (loc.latitude, loc.longitude)
    except:
        # Return missing value
        return np.nan
df['coordinates'] = df['country'].apply(geolocate)
df[['latitude', 'longitude']] = pd.DataFrame(df['coordinates'].tolist(), index=df.index)
df.head(3)
| country | text | continent | coordinates | latitude | longitude | |
|---|---|---|---|---|---|---|
| 0 | Algeria | current situation: Algeria is a transit and, t... | Africa | (28.0000272, 2.9999825) | 28.000027 | 2.999983 |
| 1 | Antigua and Barbuda | current situation: Antigua and Barbuda is a de... | North America | (17.2234721, -61.9554608) | 17.223472 | -61.955461 |
| 2 | Belarus | current situation: Belarus is a source, transi... | Europe | (53.4250605, 27.6971358) | 53.425061 | 27.697136 |
df[df.isnull().any(axis=1)]
df.continent.unique()
array(['Africa', 'North America', 'Europe', 'South America', 'Asia',
       'Oceania'], dtype=object)
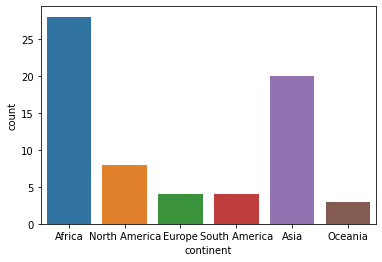
Turns out Africa has the most number of countries as a continent.
ax = sns.countplot(x="continent", data=df)
Use pycountry_convert to get country code.
def country_to_code(country_name):
    try:
        country_alpha2 = pc.country_name_to_country_alpha2(country_name)
        return country_alpha2
    except:
        return float("NaN")

df['code'] = df['country'].apply(country_to_code)
df.head(3)
| country | text | continent | coordinates | latitude | longitude | code | |
|---|---|---|---|---|---|---|---|
| 0 | Algeria | current situation: Algeria is a transit and, t... | Africa | (28.0000272, 2.9999825) | 28.000027 | 2.999983 | DZ |
| 1 | Antigua and Barbuda | current situation: Antigua and Barbuda is a de... | North America | (17.2234721, -61.9554608) | 17.223472 | -61.955461 | AG |
| 2 | Belarus | current situation: Belarus is a source, transi... | Europe | (53.4250605, 27.6971358) | 53.425061 | 27.697136 | BY |
df[df.isnull().any(axis=1)]
| country | text | continent | coordinates | latitude | longitude | code | |
|---|---|---|---|---|---|---|---|
| 23 | The Gambia | current situation: The Gambia is a source and ... | Africa | (13.470062, -15.4900464) | 13.470062 | -15.490046 | NaN |
Code is not recognized for The Gambia, so I manually added with Wikipedia's help.
df.loc[df['country'] == 'The Gambia', 'code'] = 'GM'
df[df.isnull().any(axis=1)]
| country | text | continent | coordinates | latitude | longitude | code |
|---|
Delete 'current situation: ' from text, since it is repeated in all country descriptions.
df['text'] = df['text'].str.replace('current situation: ', '')
df.head(3)
| country | text | continent | coordinates | latitude | longitude | code | |
|---|---|---|---|---|---|---|---|
| 0 | Algeria | Algeria is a transit and, to a lesser extent, ... | Africa | (28.0000272, 2.9999825) | 28.000027 | 2.999983 | DZ |
| 1 | Antigua and Barbuda | Antigua and Barbuda is a destination and trans... | North America | (17.2234721, -61.9554608) | 17.223472 | -61.955461 | AG |
| 2 | Belarus | Belarus is a source, transit, and destination ... | Europe | (53.4250605, 27.6971358) | 53.425061 | 27.697136 | BY |
Text preprocessing
def preprocess_text(text):
    # Tokenise words while ignoring punctuation
    text = ''.join([i for i in text if not i.isdigit()])
    tokeniser = RegexpTokenizer(r'\w+')
    tokens = tokeniser.tokenize(text)

    # Lowercase and lemmatise
    lemmatiser = WordNetLemmatizer()
    lemmas = [lemmatiser.lemmatize(token.lower(), pos='v') for token in tokens]

    # Remove stopwords
    keywords= [lemma for lemma in lemmas if lemma not in stopwords.words('english')]
    return " ".join(str(x) for x in keywords)

df['text'] = df['text'].apply(preprocess_text)
df.head(3)
| country | text | continent | coordinates | latitude | longitude | code | |
|---|---|---|---|---|---|---|---|
| 0 | Algeria | algeria transit lesser extent destination sour... | Africa | (28.0000272, 2.9999825) | 28.000027 | 2.999983 | DZ |
| 1 | Antigua and Barbuda | antigua barbuda destination transit country ad... | North America | (17.2234721, -61.9554608) | 17.223472 | -61.955461 | AG |
| 2 | Belarus | belarus source transit destination country wom... | Europe | (53.4250605, 27.6971358) | 53.425061 | 27.697136 | BY |
Compute TF-IDF
tfIdfVectorizer=TfidfVectorizer(use_idf=True)
tfIdf = tfIdfVectorizer.fit_transform(df['text'])
feature_names = tfIdfVectorizer.get_feature_names()
tfIdf_df = pd.DataFrame(tfIdf[0].T.todense(), index=feature_names, columns=["TF-IDF"])
tfIdf_df = tfIdf_df.sort_values('TF-IDF', ascending=False)
tfIdf_df.head()
| TF-IDF | |
|---|---|
| algeria | 0.451134 |
| sub | 0.314730 |
| saharan | 0.314730 |
| traffic | 0.218949 |
| arrest | 0.159665 |
dist = 1 - cosine_similarity(tfIdf)
dist
array([[ 0.00000000e+00,  8.69501828e-01,  8.94652139e-01, ...,
         8.31762669e-01,  8.42474686e-01,  8.36378215e-01],
       [ 8.69501828e-01, -6.66133815e-16,  8.98853440e-01, ...,
         8.72956588e-01,  8.96750877e-01,  8.86675427e-01],
       [ 8.94652139e-01,  8.98853440e-01, -2.22044605e-16, ...,
         8.67939405e-01,  8.82415064e-01,  8.99825887e-01],
       ...,
       [ 8.31762669e-01,  8.72956588e-01,  8.67939405e-01, ...,
        -6.66133815e-16,  8.18038027e-01,  7.76779197e-01],
       [ 8.42474686e-01,  8.96750877e-01,  8.82415064e-01, ...,
         8.18038027e-01, -2.22044605e-16,  8.28938643e-01],
       [ 8.36378215e-01,  8.86675427e-01,  8.99825887e-01, ...,
         7.76779197e-01,  8.28938643e-01,  0.00000000e+00]])
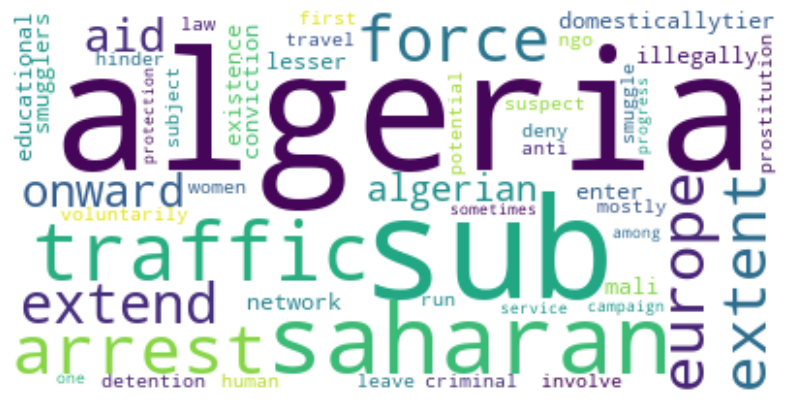
Algeria seems to occur frequently in the world map.
wordcloud = WordCloud(background_color="white", max_words=50).generate_from_frequencies(tfIdf_df.sum(axis=1))
plt.figure(figsize=(10,8), dpi= 100)
plt.axis("off")
plt.imshow(wordcloud, interpolation='bilinear')
<matplotlib.image.AxesImage at 0x2129ee9f880>
Compute polarity and subjectivity based on pre-processed text
def polarity(x):
    return TextBlob(x).sentiment[0]

def subjectivity(x):
    return TextBlob(x).sentiment[1]

df['polarity'] = df['text'].apply(polarity)
df['subjectivity'] = df['text'].apply(subjectivity)

df.head(3)
| country | text | continent | coordinates | latitude | longitude | code | polarity | subjectivity | |
|---|---|---|---|---|---|---|---|---|---|
| 0 | Algeria | algeria transit lesser extent destination sour... | Africa | (28.0000272, 2.9999825) | 28.000027 | 2.999983 | DZ | -0.031250 | 0.348750 |
| 1 | Antigua and Barbuda | antigua barbuda destination transit country ad... | North America | (17.2234721, -61.9554608) | 17.223472 | -61.955461 | AG | 0.100671 | 0.457554 |
| 2 | Belarus | belarus source transit destination country wom... | Europe | (53.4250605, 27.6971358) | 53.425061 | 27.697136 | BY | -0.013889 | 0.219444 |
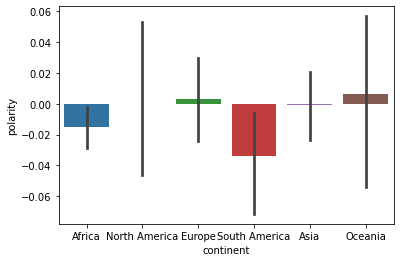
South America has the lowest polarity
sns.barplot(x = "continent", y = "polarity", data = df)
plt.show()
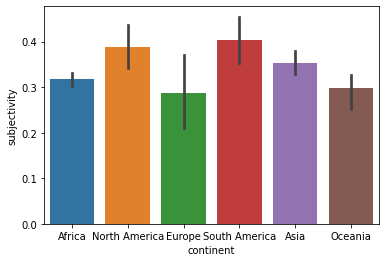
However, it also has the highest subjectivity.
sns.barplot(x = "continent", y = "subjectivity", data = df)
plt.show()
I have to use the display_svg function to show the svg in my notebook. Using pygal library on country code and polarity/subjectivity, I can use colour to represent the intensity of the values in each country.
def display_svg(svg_code):
 return SVG(svg_code)

polarity_dict = dict(zip(df.code.str.lower(), df.polarity))

# create a world map
worldmap1 =  pygal.maps.world.World()

# set the title of the map
worldmap1.title = 'CIA Human Trafficking Polarity'

worldmap1.add('Polarity', polarity_dict)
display_svg(worldmap1.render())

Because I want to zoom in and see the actual values, I use folium to get interactive map.
world_map= folium.Map(tiles="cartodbpositron")
marker_cluster = MarkerCluster().add_to(world_map)

for i in range(len(df)):
        lat = df.iloc[i]['latitude']
        long = df.iloc[i]['longitude']
        radius=5
        popup_text = """Country : {}<br>
                    Polarity : {}<br>"""
        popup_text = popup_text.format(df.iloc[i]['country'],
                                   df.iloc[i]['polarity']
                                   )
        folium.CircleMarker(location = [lat, long], radius=radius, popup= popup_text, fill =True).add_to(marker_cluster)

world_map
subjectivity_dict = dict(zip(df.code.str.lower(), df.subjectivity))

# create a world map
worldmap2 =  pygal.maps.world.World()

# set the title of the map
worldmap2.title = 'CIA Human Trafficking Subjectivity'

worldmap2.add('Subjectivity', subjectivity_dict)
display_svg(worldmap2.render())

world_map= folium.Map(tiles="cartodbpositron")
marker_cluster = MarkerCluster().add_to(world_map)

for i in range(len(df)):
        lat = df.iloc[i]['latitude']
        long = df.iloc[i]['longitude']
        radius=5
        popup_text = """Country : {}<br>
                    Subjectivity : {}<br>"""
        popup_text = popup_text.format(df.iloc[i]['country'],
                                   df.iloc[i]['subjectivity']
                                   )
        folium.CircleMarker(location = [lat, long], radius=radius, popup= popup_text, fill =True).add_to(marker_cluster)

world_map
And that's it. If you want to contact me, feel free to reach out to my email.